Game Marketing KPIs: The Steam Metrics That Matter by Phase
The few game marketing KPIs that predict a Steam launch: wishlist velocity, visit to wishlist rate, cost per wishlist, demo playtime, conversion, reviews.
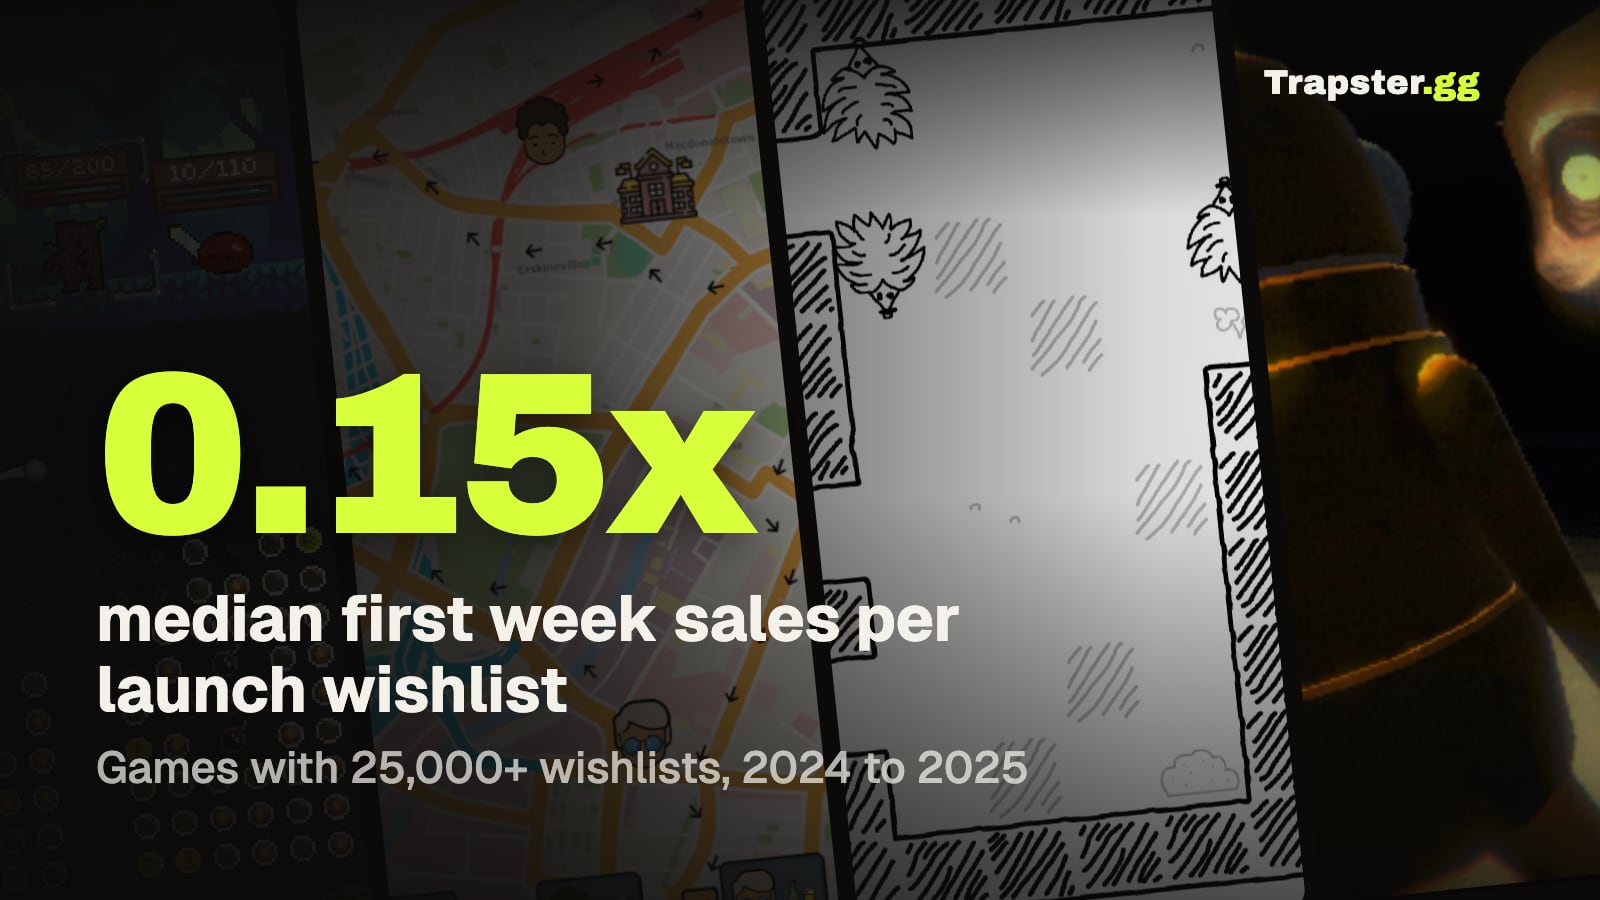
Short answer: For a Steam game, the KPIs that matter are a short list that changes by phase: wishlists per day before launch, the share of store page visitors who wishlist, demo players and their median playtime, cost per wishlist on anything you pay for, then first week sales against launch wishlists and your review count and score after release. Almost all of it lives in two Steamworks places: the Store & Steam Platform Traffic Breakdown and the Wishlists section of the Sales & Activation Reports. Useful public medians exist: GameDiscoverCo puts the typical follower to wishlist ratio at 9.6x and first week sales at 0.15x launch wishlists for games with 25,000+ wishlists. Track a handful of these weekly, compare against your own trend first and benchmarks second.
Why most game marketing dashboards track the wrong things
Follower counts and trailer views feel like progress, but they only matter when they turn into store visits and wishlists.
A KPI earns a place on your sheet if it answers one of three questions:
- Are enough people finding the store page?
- Is the store page (and the demo) turning them into wishlists?
- Are those wishlists turning into sales and good reviews at launch?
If a number answers none of them, check it once a quarter instead of weekly.
The KPIs by phase
| Phase | KPI | Where it lives | Public benchmark |
|---|---|---|---|
| Store page live | Wishlists per day (baseline) | Steamworks Wishlists report | Near zero to 200 per day (GameDiscoverCo) |
| Store page live | Visit to wishlist rate | Traffic Breakdown visits + Wishlists report | No reliable public median; track your own trend |
| Store page live | Follower to wishlist ratio | Public followers + your wishlists | Median 9.6x, range 5x to 14x (GameDiscoverCo) |
| Any paid push | Cost per wishlist | UTM Analytics + ad spend | About $1 to $2.50 in two public indie ad tests (below) |
| Demo / Next Fest | Demo players, median playtime | Sales & Activation Reports, demo product | Median 14 minutes (How To Market A Game) |
| Demo / Next Fest | Demo player to wishlist rate | End of festival Venn report | Median 16.33% (How To Market A Game) |
| Launch | First week sales ÷ launch wishlists | Sales report + Wishlists report | Median 0.15x, 0.10x above $10 (GameDiscoverCo) |
| Post launch | Review count and score | Store page review summary | Overwhelmingly Positive games sold a median 0.51x wishlists in Month 1 (GameDiscoverCo) |
Pre-launch KPI 1: wishlists per day and velocity
Total wishlists is the number everyone quotes. The more useful number is how many you gain on a normal day with nothing special going on. Simon Carless at GameDiscoverCo called this baseline daily wishlists and argued it predicts launch better than the total, because totals get inflated by festivals and features that bring in less committed players.
His examples are worth knowing. Batbarian: Testament of the Primordials had over 20,000 pre-release wishlists, but its organic rate sat around 5 to 10 a day for most of the year before launch, and it launched with only 70 user reviews. An unnamed "sleeper" game running about 25 a day a few weeks before launch sold roughly 5,000 copies in week one. Across titles he saw baseline rates from near zero up to 200 a day.
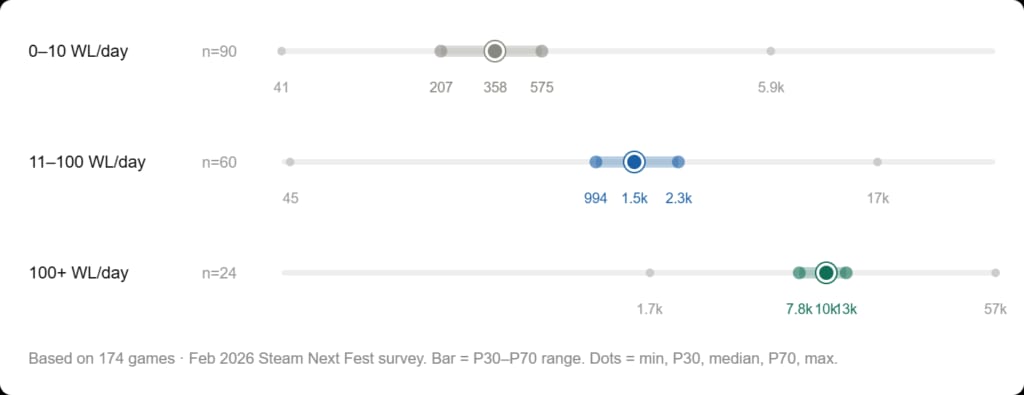
Velocity also predicts how much a festival will help. In How To Market A Game's February 2026 Next Fest survey (182 responses), games whose pages had averaged 0 to 10 wishlists a day over their lifetime earned a median 358 wishlists during the fest. At 11 to 100 a day the median was 1,470, and at 100+ a day it was 10,229. Total wishlists before the fest had the strongest correlation with fest results (Spearman r of 0.825).
Where to find it: Steamworks, your app, Sales & Activation Reports, the Wishlists section. Valve says it "tracks additions, purchases, and deletions" and that wishlist data is updated daily for the previous date. Log net adds (adds minus deletes) per day, and mark the days you had a festival, feature or big post so you can see the baseline between spikes.
How much velocity matters for visibility is debated. Valve's own wording is that "Wishlists can be an important factor in determining where your game appears on Steam," and it also says there is no minimum wishlist count before Steam shows a game. Treat velocity as a demand signal first.
Pre-launch KPI 2: store page visit to wishlist rate
This tells you whether the page itself works. Steamworks does not show it as one number. You divide wishlist adds (Wishlists report) by store page visits for the same period.
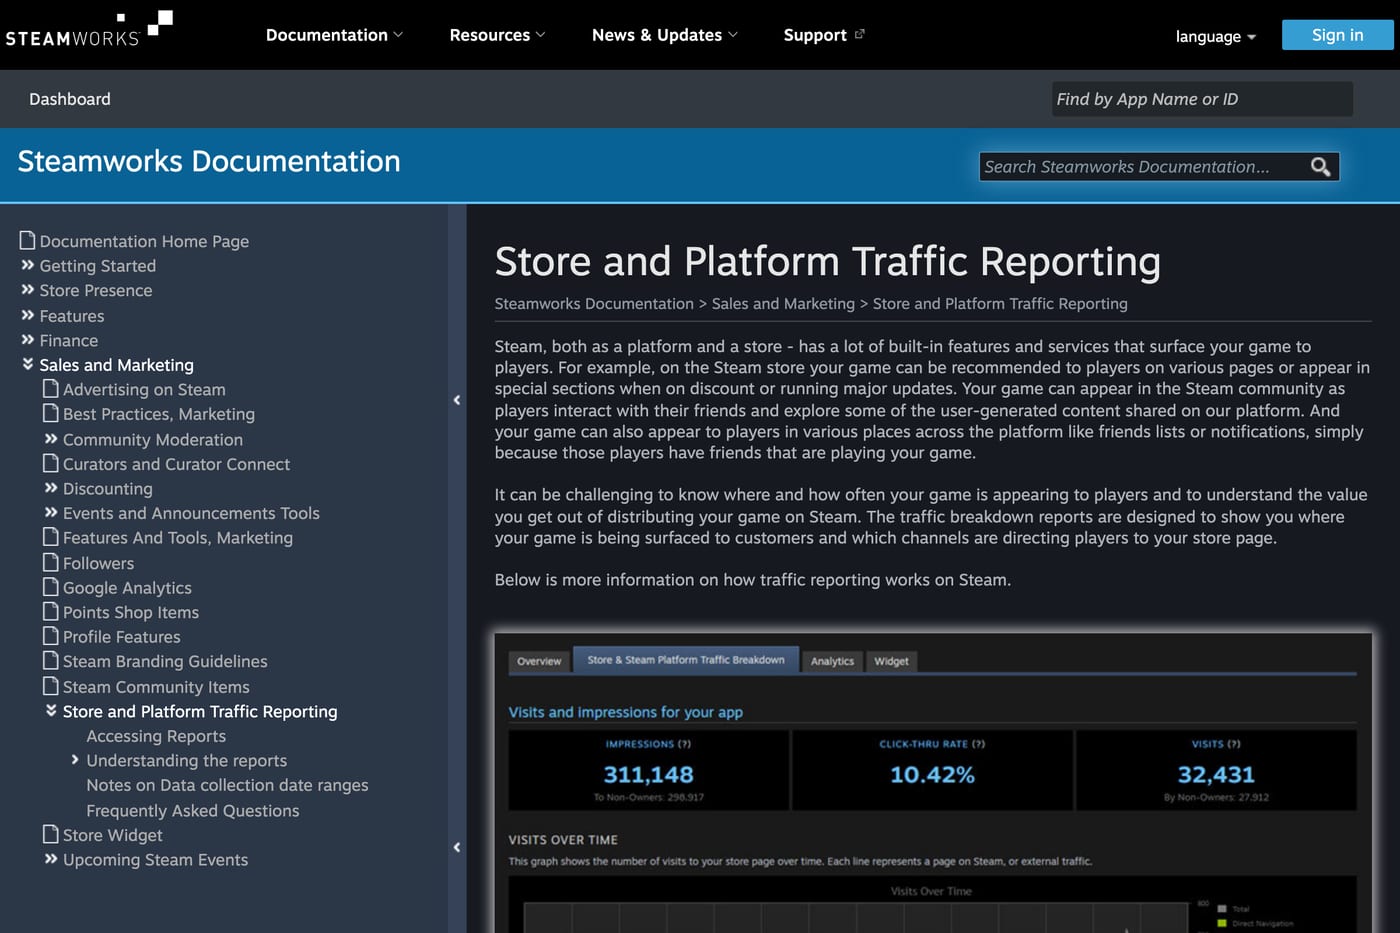
Where visits live: your app's landing page in Steamworks, Marketing Tools & Data, Marketing & Visibility, then the Store & Steam Platform Traffic Breakdown tab. Valve defines visits as "unique page loads of your product's store page" and click-thru rate as "the percentage of impressions that result in visits to the store page." Since March 23, 2021 those reports exclude users who opted out of the relevant cookies, so the denominator undercounts a bit.
Read this rate per traffic source, not as one blended number. A visitor who came from a creator video they just watched behaves differently from one who clicked a capsule in a sale list. GameDiscoverCo flagged a case where SENTRY picked up over 1,500 wishlists from a pre-release sale feature with an implied 35% page to wishlist rate, and the likely reason was people clicking the wishlist button on the sale page capsule without deep interest. A high rate from one source can mean low quality wishlists.
Valve does not publish a store page conversion benchmark, and the numbers that circulate online trace back to small or unsourced samples. The honest approach: record your own rate weekly, change one thing on the page (the capsule or the first screenshot), and watch whether the rate moves over the next two weeks of comparable traffic.
Pre-launch KPI 3: follower to wishlist ratio
Followers are public on Steam, wishlists are not. That is why this ratio matters: it lets you size up competitors, and it lets publishers sanity check your claims.
GameDiscoverCo's survey of 113 unreleased games found a median of 9.6 wishlists per follower, with most games between 5x and 14x. Games that had been in a Steam festival sat around 10x, and games with neither a festival nor a pre-release feature at 7.77x. After launch the ratio collapses, because purchases remove wishlists while followers stay.
Peglin is a good real example. How To Market A Game's Peglin breakdown reports about 4,000 followers and 76,000 wishlists at its Early Access launch, roughly 19 wishlists per follower, well above the median. Its audience wishlisted far more often than it followed.

If your own ratio drifts far from its history after a campaign, check which source drove the change.
Pre-launch KPI 4: cost per wishlist
Any time you pay for attention (ads or a paid creator push), divide what you spent by the wishlists you can attribute to it. This is the only KPI that tells you whether to spend more.
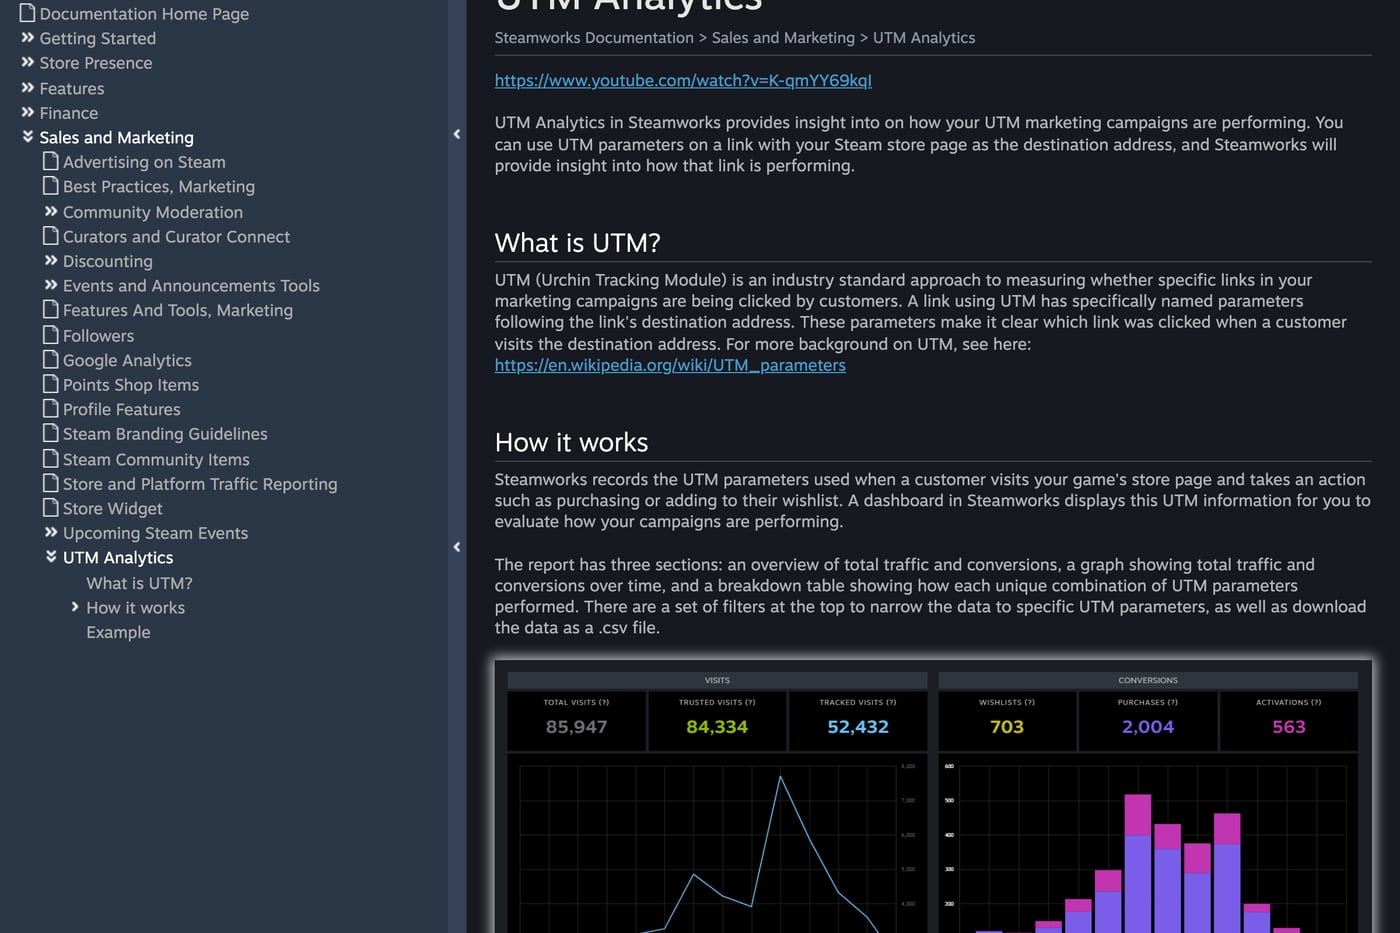
Where to find it: set up a tagged link for each channel and read conversions in UTM Analytics, a tab in the same Marketing & Visibility section. Valve counts a wishlist if it happens "within 72 hours of clicking through your UTM link," only for logged-in ("tracked") visits, and finalizes conversions 4 days after the visit. Anyone who sees your ad, closes it and searches Steam later is invisible to UTM, so tracked cost per wishlist is a ceiling, not the true cost. The Steam UTM tracking guide walks through the setup.
Two public indie tests:
- This Grand Life 2. Solo developer Patrick Tang spent $4,365, mostly on Reddit ads with some Twitter and Facebook, for about 4,000 wishlists. That is $1.10 per wishlist on average, ranging from $0.80 to $2.50 by ad group, and the game reached Popular Upcoming at 5,228 wishlists. Mobile was 96% of tracked wishlists.
- Match Morphosis. The developer of this match-3 game spent $925 of a $1,000 Reddit budget in December 2025 for about 600 tracked wishlists, roughly $1.50 each, with CPCs of $0.20 to $0.30.

Cost per wishlist only means something next to what a wishlist is worth to you. As a rough estimate, at a 0.15x first week conversion, $1.50 per wishlist costs $10 per first week sale before Valve's cut, which is fine for a $25 game and painful for a $5 one. Our cost per wishlist by genre breakdown has more reference points.
Demo and Next Fest KPIs: players, median playtime, demo to wishlist rate
A demo gives you three numbers you cannot get any other way.
Demo players. Total unique players over the festival or the first two weeks after release. Compare it to your wishlists gained in the same window.
Median playtime. Chris Zukowski collected medians from 130 demos: the overall median was 14 minutes (30th percentile 10, 70th percentile 22). Among 62 released games grouped by revenue, the lowest tier had a median of 7 minutes and the higher tiers 18, 38 and 65 minutes. One developer, Tower Escape, moved its median from 15 to 42 minutes after balance changes and making easy the default difficulty. In Steamworks this is in the Sales & Activation Reports: Products, pick the demo, then "Median time played." Write it down before and after each demo update.
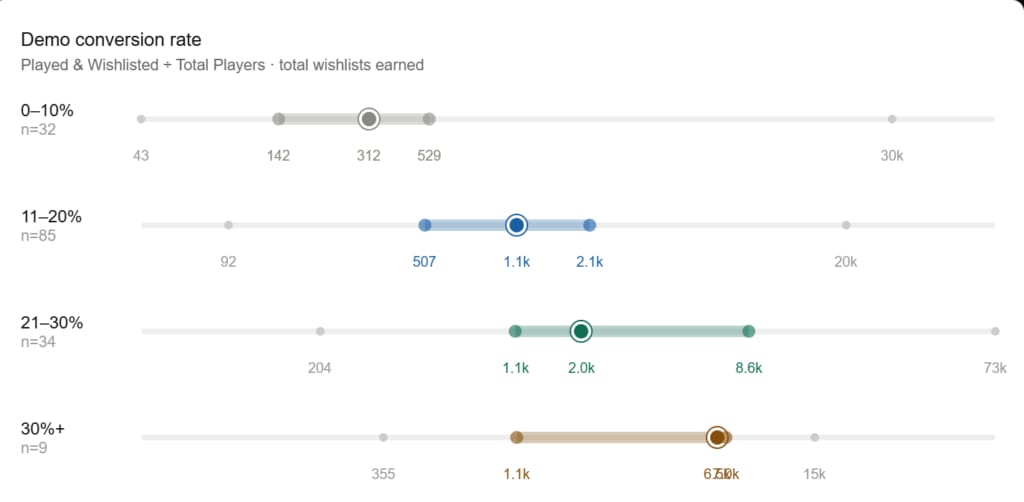
Demo player to wishlist rate. At the end of Next Fest, Valve shows a Venn report of people who played versus wishlisted. How To Market A Game defines demo conversion as played and wishlisted divided by total players and found a median of 16.33% (30th percentile 12%, 70th percentile 20%). The report disappears after a few weeks, so screenshot it.
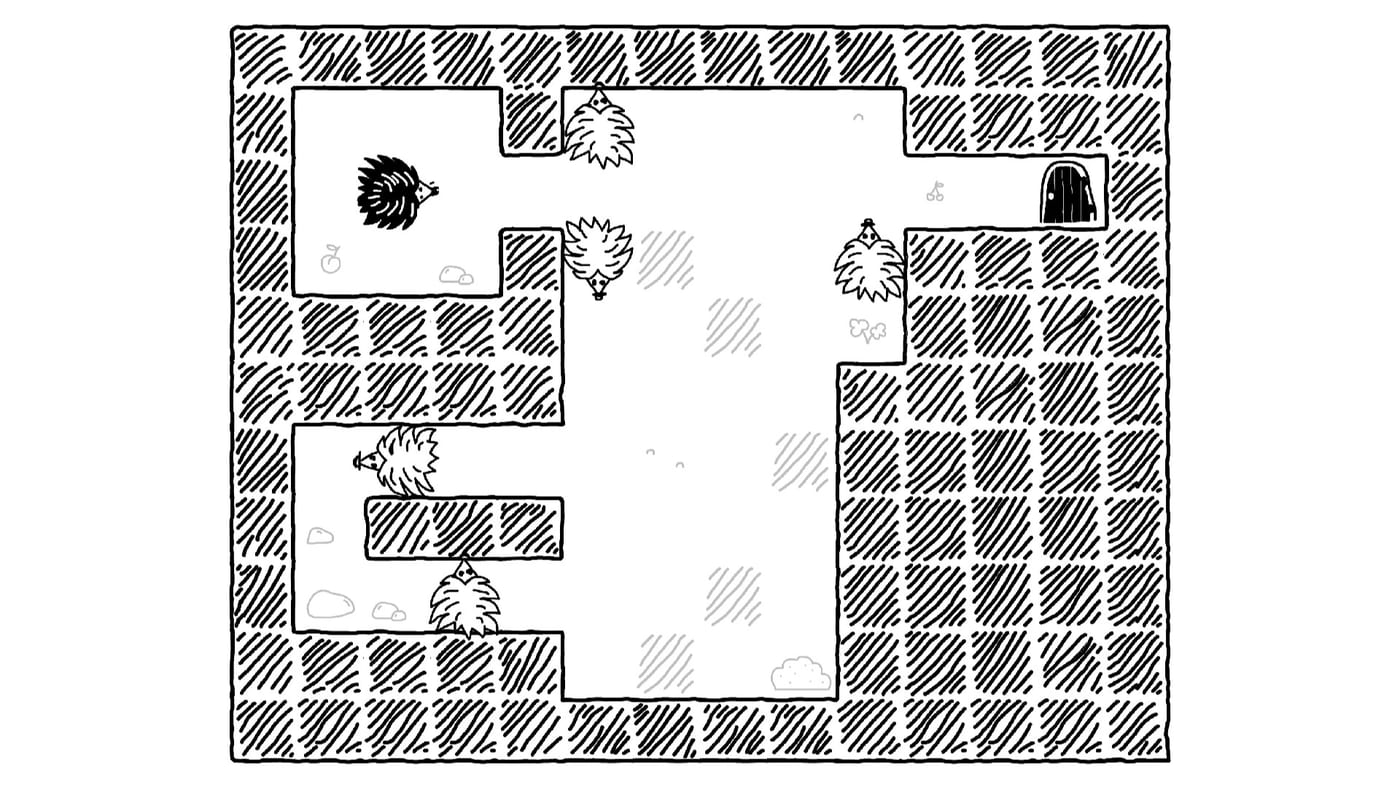
Sunbird Studio's Prickle postmortem reports about 450 wishlists before the demo, about 115 from the demo launch, roughly 100 a day during Next Fest, about 1,100 demo players and around 2,400 wishlists at its November 2024 launch.
Next Fest itself got more crowded in 2026. GameDiscoverCo counted 4,382 demos in June 2026, up from 2,645 a year earlier, and a top 10% game gained about 121 followers during the event (down from 163). Judge your festival against your own velocity before it, not against last year's headlines. The Steam demo marketing guide covers what to change when these numbers are low.
Launch KPI: first week sales against launch wishlists
The standard launch KPI is first week units divided by wishlists at launch. GameDiscoverCo's 2024 to 2025 analysis puts the median at 0.15x for games launching with 25,000+ wishlists, and 0.10x for games priced above $10. The spread is huge. GameDiscoverCo's top converters included online co-op games such as PEAK and R.E.P.O., which it says went extremely viral with influencers and friend groups. An earlier GameDiscoverCo survey of 100+ games found a median of 0.20x, with Tchia at about 0.07x as a low example.

This ratio counts all buyers, not just wishlisters. Peglin's first week makes the point: 80,204 units on 76,000 launch wishlists, but only 28,419 of those buyers had it wishlisted, and 51,205 had never wishlisted it. The same report showed 8,263 wishlist deletes.
Where to find it: the Wishlists section shows purchases from wishlists and deletions; the sales report shows total units. Pull both for days 1 to 7. Our wishlist conversion rate guide explains why the ratio swings by an order of magnitude between games.
Also note the long tail. GameDiscoverCo's 2024 survey found median Month 1 gross revenue at 1.39x Week 1 and Year 1 at 3.16x, so a weak first week is not the whole story.
Post-launch KPIs: review count and review score
Two numbers matter here, and they do different jobs.
Review score affects whether people buy. GameDiscoverCo's analysis of about 700 games released after September 2023 found median Month 1 sales of about 27% of launch wishlists overall, rising to 0.51x for Overwhelmingly Positive games, with significant drop-offs at Mixed. In the 2024 to 2025 data, underperformers had a median 67% score in their first seven days against 91% for overperformers. For Valve's algorithm, the threshold is lower: "As long as your game's reviews are Mixed or above (40%+), review score is not a factor" in visibility, per the Steamworks user reviews doc. Only reviews from Steam purchases count toward the score, not key activations.
Review count is your public proxy for sales, and the one competitors and publishers will use on you. Peglin had 1,071 reviews after its first week, or 74 sales per review. Gamalytic data covered by GameDiscoverCo put the multiple at about 36 sales per review for games with under 100 reviews and 52.8 for games with 1,000 to 10,000. Track your own sales per review so you can read other games' counts accurately. The review score guide covers the thresholds and labels.
A simple weekly dashboard template
One row per week, one sheet per game. Fill it every Monday from Steamworks; it takes about 15 minutes.
| Column | Source | Pre-launch | Launch month | Post launch |
|---|---|---|---|---|
| Net wishlist adds (adds minus deletes) | Wishlists report | Yes | Yes | Yes |
| Average net adds per day, excluding event days | Wishlists report | Yes | ||
| Store page visits | Traffic Breakdown | Yes | Yes | Yes |
| Visit to wishlist rate | Adds ÷ visits | Yes | ||
| Top 3 traffic sources by visits | Traffic Breakdown | Yes | Yes | |
| Followers, wishlists ÷ followers | Steam Community page + Wishlists report | Yes | ||
| Spend and tracked wishlists per channel, cost per wishlist | UTM Analytics + invoices | Yes | Yes | Yes |
| Demo players, median time played | Sales & Activation Reports (demo) | When live | ||
| Units sold, units ÷ launch wishlists | Sales report | Yes | Yes | |
| Review count, % positive, sales per review | Store page | Yes | Yes | |
| Notes: what changed this week | You | Yes | Yes | Yes |
The notes column matters most. When a number moves, you want to know whether it was the new capsule or a creator video, and you will not remember three months later.
Three habits make the sheet useful:
- Mark event weeks (festivals, features, sales, big creator drops) so you can separate baseline from spikes.
- Use a UTM link for every outbound channel from day one, including creator campaigns. If you run creator content, measuring wishlists from a creator campaign shows how to read the lift beyond the tracked clicks.
- Judge trends over 4 weeks. Single weeks are noisy for small games.
What good looks like, roughly
For a small team aiming at a commercial launch, these are reasonable checkpoints drawn from the sources above, not rules:
- A year out: a page live and a baseline that is clearly above single digits per day.
- Before Next Fest: How To Market A Game's 2026 data shows the bracket you enter with mostly decides the bracket you leave with. Games entering with 1,000 to 9,999 wishlists earned a median 1,006 during the fest; games with 10,000 to 99,999 earned a median 5,215.
- Demo: median playtime above the 14 minute survey median and a demo to wishlist rate near 20%.
- Paid tests: cost per wishlist you can justify at a 0.10x to 0.15x first week conversion for your price.
- Launch: review score above 80% in week one, since the gap between under and overperformers in GameDiscoverCo's data was 67% versus 91%.
For context, publisher Polden will sign Aliens Took My Stuff if it reaches 50,000 wishlists, per GameDiscoverCo, after spending around $3,000 on a trailer and $5,000 on influencers. Know which number your own deal or budget actually depends on and put it at the top of the sheet.
FAQ
What are the most important KPIs for a Steam game?
Before launch: wishlists per day, store page visit to wishlist rate and cost per wishlist on paid channels. At and after launch: first week sales against launch wishlists, review score and review count.
What is a good wishlist conversion rate on Steam?
GameDiscoverCo's median for 2024 to 2025 launches with 25,000+ wishlists was 0.15x first week sales per launch wishlist, and 0.10x for games above $10.
How many wishlists per day is good?
GameDiscoverCo saw baseline rates from near zero to 200 a day. One game averaging about 25 a day before launch sold around 5,000 copies in week one.
Where do I see store page traffic in Steamworks?
Your app's landing page, Marketing Tools & Data, Marketing & Visibility, Store & Steam Platform Traffic Breakdown. UTM Analytics is a separate tab in the same section.
What is a good median playtime for a Steam demo?
How To Market A Game's survey of 130 demos found a median of 14 minutes, and higher earning games tended to have longer medians, from 7 minutes in the lowest revenue tier to 65 in the highest.
How do I estimate a game's wishlists from its followers?
Multiply followers by about 9.6, GameDiscoverCo's median from 113 unreleased games, and expect anywhere from 5x to 14x. It only works before launch.
How many sales does one Steam review equal?
Gamalytic data covered by GameDiscoverCo found about 36 for games with under 100 reviews and 52.8 for games with 1,000 to 10,000. Peglin's first week worked out to 74.
Sources: Steamworks documentation (wishlists, traffic reporting, UTM analytics, user reviews); GameDiscoverCo newsletter (baseline daily wishlists, followers and wishlists, wishlist conversion 2024 and 2024 to 2025, user reviews and Month 1 sales, review counts, June 2026 Next Fest); How To Market A Game (Peglin, demo median playtime, February 2026 Next Fest benchmarks); Game World Observer (This Grand Life 2); Match Morphosis developer blog; Sunbird Studio Prickle postmortem; checked November 2026.
Get a wishlist forecast for your game
Send us your Steam page. We estimate views, creators and cost per wishlist before you spend anything.
Keep reading
Twitter for Game Developers: Is X Still Worth It in 2026?
Is X still worth it for indie devs? Link penalty facts, Bluesky…

How to Market a Strategy Game: 4X, RTS and City Builders
How to market a strategy game on Steam: who buys it, demos…
Instagram Reels for Game Developers: Ranking, Formats, Steam Links
How Instagram ranks Reels, which game formats work, how to send viewers…